Blog post
CRM Sales Dashboard KPIs: 9 Numbers to Review Every Week
Nine KPIs that tell a sales manager what is working, what is stuck and who needs help, plus a 30-minute agenda for reading the dashboard every week.
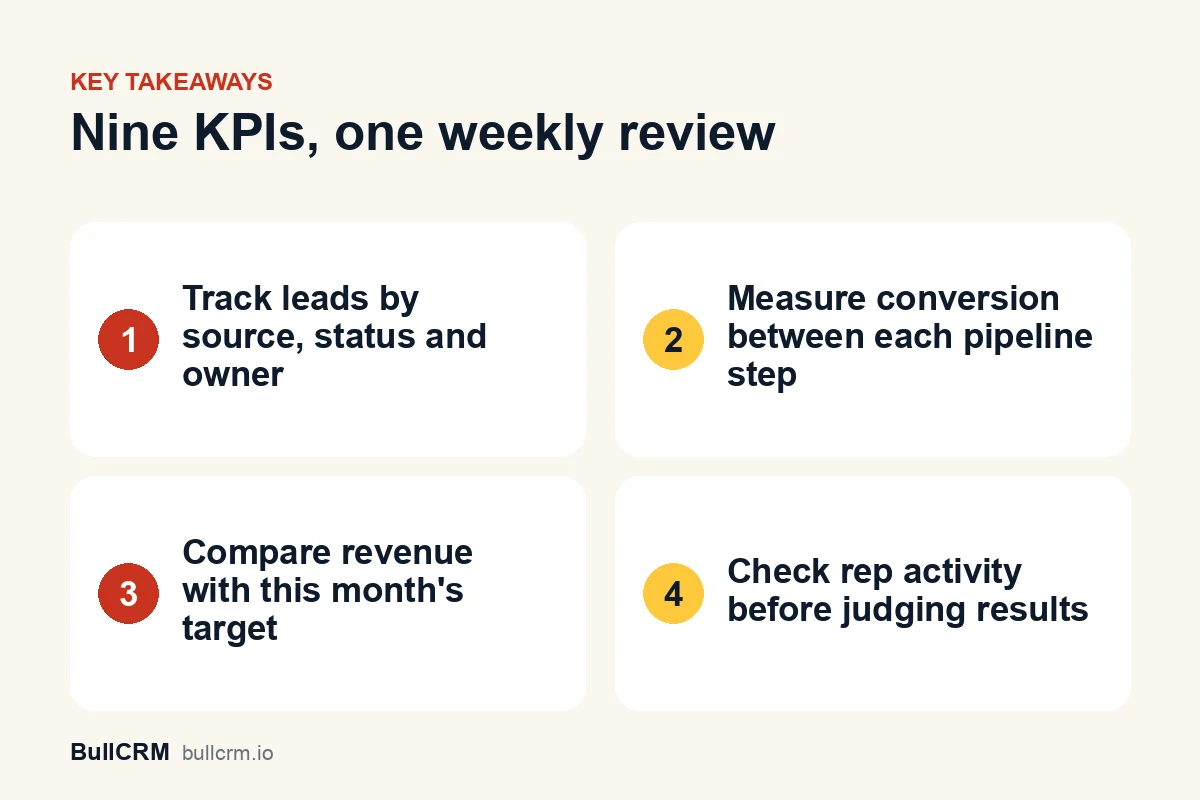
The CRM sales dashboard KPIs that matter most for a small or mid-size team fit on one screen: new leads, leads by source, leads by status, leads by salesperson, lead-to-opportunity conversion, deal value by stage, win rate, revenue against target and rep activity. Together these nine numbers answer three weekly questions. Are enough leads coming in, are they moving, and is the team doing the work? Anything beyond that is usually detail for a specific problem, not for the weekly review.
What are the nine KPIs, and what does each one tell you?
Use this table as your checklist. The last column is the question to ask when a number looks wrong.
| KPI | What it shows | Ask this when it moves |
|---|---|---|
| 1. New leads | The volume of fresh demand this week | Did a campaign start or stop? |
| 2. Leads by source | Which channels bring leads | Is our effort going to the best source? |
| 3. Leads by status | Where leads are sitting | Why are so many still marked "New"? |
| 4. Leads by salesperson | How work is spread across reps | Is anyone overloaded or idle? |
| 5. Lead-to-opportunity conversion | The share of leads that qualify | Is lead quality or follow-up the issue? |
| 6. Deal value by stage | The money sitting at each stage | Where do deals stall? |
| 7. Win rate | The share of closed deals that are won | Are we losing on price, timing or fit? |
| 8. Revenue against monthly target | Progress towards this month's goal | Can the gap still be closed? |
| 9. Rep activity | Calls, tasks and meetings logged | Does effort match the pipeline? |
Lead KPIs: is enough of the right demand coming in?
The first four KPIs describe the top of your funnel. Read them together, because a rise in new leads means little if the leads come from a weak source and then sit untouched.
Leads by source
This is the KPI that supports, or questions, your marketing spend. If your website form brings fewer leads than walk-ins but they convert far more often, that changes where you put effort. Make the source field mandatory when leads are captured, or this chart turns into one large "Unknown" slice.
Leads by status
A healthy status chart shows leads moving out of "New" within your response target. A growing pile of new leads is the earliest warning that follow-up is slipping. Our guide to the lead management process includes a short status workflow that keeps this chart readable.
Leads by salesperson
Uneven workloads hide problems. One rep with sixty open leads and another with ten usually means the assignment rules need a look, not that one rep is lazy. BullCRM's reporting dashboards show leads by status, source and salesperson, plus a country map of where leads come from, which helps if you also sell abroad.
Pipeline KPIs: are leads turning into deals?
Once leads qualify, the question shifts from volume to movement. These KPIs tell you whether your pipeline is flowing or simply getting fuller.
Lead-to-opportunity conversion
Divide the leads that became opportunities by all leads that reached a final status in the same period. Low conversion from one source points to lead quality, while low conversion across every source points to follow-up or qualification. Track it by source and by rep to tell the two apart.
Deal value by stage
This shows how much money sits in each stage and where it piles up. A bulge at "Proposal" might mean quotes are going out without a follow-up plan. Clear stage definitions make this chart trustworthy, and our guide to sales pipeline stages covers exit criteria for each one.
The stages themselves should match how your team really sells. With pipeline management in the CRM, you name your deal stages, give each one a colour and set their order in Setup.
Win rate and expected revenue
Win rate is closed-won deals divided by all closed deals. Work it out monthly, since a single week is too small a sample for most teams. Deals can also carry a probability, and value multiplied by probability gives expected revenue, which is a rough guide rather than a forecast.
Is the team on track for this month's target?
Revenue against target is the number owners watch most closely, so read it with context. Set monthly lead and revenue targets, then compare closed-won revenue and expected revenue by salesperson against them.
- Ahead of target by mid-month: check that next month's pipeline is not being neglected.
- Behind, with a full pipeline: look at stalled stages and push decisions forward.
- Behind, with a thin pipeline: the problem is lead volume, so go back to the lead KPIs.
One practical point for Indian businesses: decide whether your targets and deal values include GST, and keep that choice consistent. CRM revenue is a sales view and may not match what you file on the GST portal line for line. Ask your accountant before using these figures for tax or finance work.
Activity KPIs: is the team doing the work?
Activity numbers explain the results above them. Low conversion with low activity calls for a coaching conversation, while low conversion with high activity points to a targeting or pitch problem.
- Calls: the number and length of calls logged on leads and contacts.
- Tasks: follow-up tasks created, and how many were completed on time.
- Meetings: demos, site visits or consultations actually held.
- Notes and updates: evidence that records are being kept current.
Activity is only measurable if logging it takes no extra effort. A click-to-call CRM dialer records each call's duration and status on the record automatically, so call activity counts itself instead of relying on reps to type it in.
How do you run a 30-minute weekly dashboard review?
A short, regular review beats a long monthly post-mortem. Keep the same agenda every week, so the team prepares without being asked.
- Minutes 0 to 5, lead intake: new leads and leads by source, compared with last week.
- Minutes 5 to 10, stuck leads: anything still "New" past your response target, with owners named.
- Minutes 10 to 20, pipeline: deal value by stage, and the three largest deals that have not moved.
- Minutes 20 to 25, target: revenue against the monthly target, and what must close to hit it.
- Minutes 25 to 30, actions: one owner and one date per action, recorded as tasks.
For example, the sales manager at a Lucknow real-estate developer might open the team performance view and spend most of the review on site visits that were booked but never followed up. The aim is to leave with actions, not just observations.
What will a sales dashboard not tell you?
Dashboards show only what was logged. If reps keep enquiries on their phones or skip status updates, the charts look calm while sales leak away. Spot-check a few records each week to confirm the data matches reality.
Built-in dashboards have limits too. BullCRM, for example, uses built-in dashboards and widgets rather than a custom report builder, and lead lists can be exported to Excel when you need a deeper cut. If reporting is part of how you compare tools, our guide to CRM pricing in India explains how to weigh plans and limits.
Frequently asked questions
How many KPIs should a sales dashboard have?
Enough to show whether leads are coming in, moving and being worked, which for most small teams means eight to ten. Beyond that, the weekly review turns into a reading exercise.
What is the difference between a KPI and a metric?
A metric is any number you can measure. A KPI is a metric you have tied to a goal and will act on when it moves. Call duration is a metric, while calls per qualified lead might be a KPI for your team.
How often should we review the dashboard?
Review it weekly as a team, with a quick daily glance at new and stuck leads. Monthly is the better rhythm for win rate and source comparisons, because weekly samples are small.
Can a CRM forecast our sales?
Some CRMs include forecasting models, while simpler ones give you deal probability and expected revenue instead. Treat expected revenue as a guide, and combine it with your own judgement on each large deal.
The best sales dashboard is the one your team reads every week and acts on. Start with these nine KPIs, run the 30-minute review and fix one leak at a time. To try the built-in dashboards with your own data, start a free trial and set your first monthly targets.